

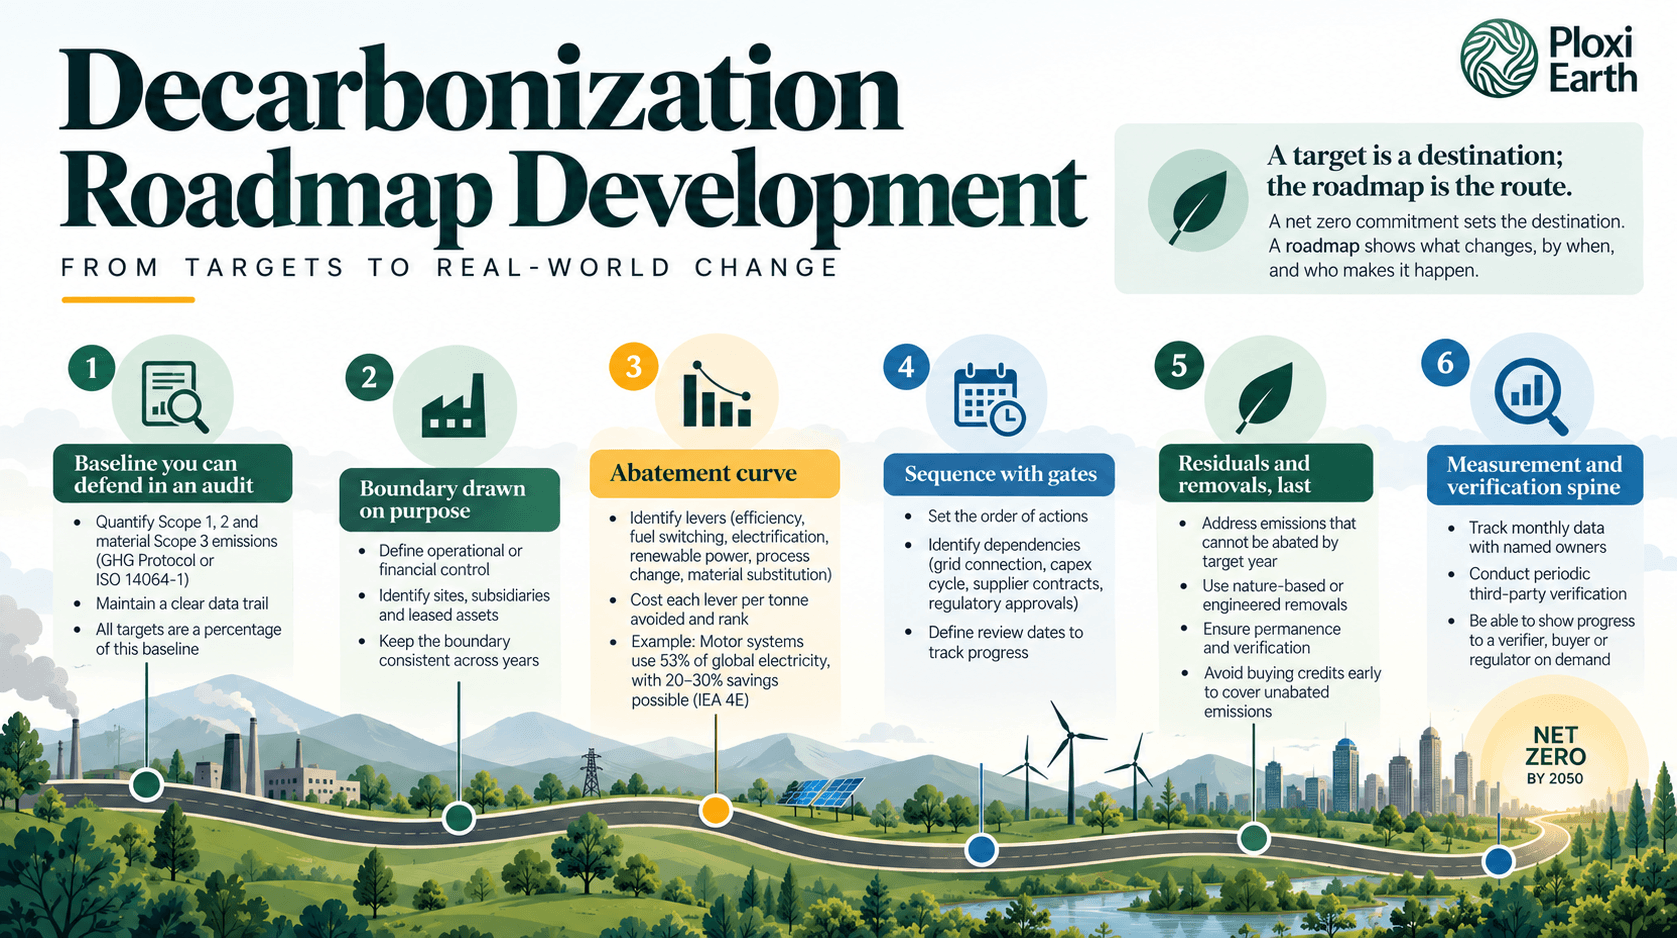
Decarbonization Roadmap Development
The Word Came from a Chip Factory
Technology roadmapping began at Motorola in the 1970s as a way to align the company’s technology investments with its product plans. Its first published roadmap, for car radios, looked ten years ahead. Cambridge IfM.
Bob Galvin was chief executive when the practice took root. In 1987, Charles Willyard and Cheryl McClees published Motorola’s Technology Roadmap Process, the first journal paper documenting the method. University of Cambridge · IRI.
The chip industry scaled the idea up.
In November 1992, Intel chairman Gordon Moore convened a workshop in Dallas where more than 170 technologists drafted a shared US roadmap for the next 15 years. By 1998, it had evolved into the International Technology Roadmap for Semiconductors (ITRS). Semiconductor Research Corporation.
Its purpose was straightforward: establish what the semiconductor industry needed to develop, and by when, to keep pace with Moore’s Law. The final edition was published in 2016. ITRS 2012 Overview · HPCwire.
For nearly a quarter of a century, a prediction about transistors was kept on schedule by a document.
That is the inheritance worth keeping when writing a decarbonization roadmap today.
A roadmap earns its name when it clearly states what must be true, by when, and who is responsible for making it happen.
A Target Is a Destination; the Roadmap Is the Route
A net-zero year can be announced in a single line.
But explaining what changes inside the plant next financial year because of that target requires a roadmap.
In India, that gap now carries regulatory and financial significance.
Under the Carbon Credit Trading Scheme (CCTS), the Ministry of Environment, Forest and Climate Change notified greenhouse gas emission-intensity targets in October 2025 for aluminium, cement, chlor-alkali, and pulp and paper, covering 282 obligated entities.
A notification in January 2026 added petroleum refineries, petrochemicals, textiles, and secondary aluminium, taking the total to 490 entities. PIB.
A revised draft for 255 iron and steel units followed in June 2026. LKS.
These targets are expressed per tonne of product against a 2023–24 baseline, with compliance years beginning in 2025–26 and 2026–27.
Intensity targets change the question a company has to answer.
A plant can grow and still comply, provided that each tonne leaving the gate carries less carbon than before.
That rewards companies that understand, process by process, where their emissions come from—and exposes those that know only their annual emissions total.
The ripple also travels down supply chains.
A cement plant’s purchased clinker, a textile mill’s dyes and steam, or a refinery’s contracted logistics can all become part of another company's Scope 3 emissions. Under the GHG Protocol, one company's Scope 3 can be another company's Scope 1 or Scope 2.
What a Working Roadmap Contains
Strip away the cover page, and a roadmap that holds up has six core components, built in this order.
-
A Baseline You Would Defend in an Audit
Quantify Scope 1, Scope 2, and material Scope 3 categories using an established framework such as the GHG Protocol or ISO 14064-1.
The underlying data trail must be maintained.
Every subsequent target is calculated against this baseline. If the baseline is wrong, the error compounds across every target, investment decision, and progress assessment that follows.
-
A Boundary Drawn on Purpose
Define the organisational and operational boundary clearly.
- Operational or financial control
- Sites and facilities covered
- Subsidiaries and business units
- Leased assets
- Joint ventures and other relevant entities
A boundary that shifts between reporting years makes genuine progress difficult to measure.
-
An Abatement Curve
Identify, quantify, and rank each emissions-reduction lever according to its potential impact and cost per tonne of emissions avoided.
Potential levers include:
- Energy efficiency
- Fuel switching
- Electrification
- Renewable power procurement
- Process optimisation
- Process transformation
- Material substitution
Motor systems are a useful example. They account for a significant share of global electricity consumption, and the IEA 4E Motor Systems Annex estimates potential energy savings of around 20–30% through improved motor-system efficiency. IEA 4E.
The objective is not simply to create a long list of initiatives.
It is to determine which interventions deliver the greatest emissions reductions at the right cost and at the right time.
-
A Sequence With Gates
A roadmap must establish what happens first, what follows, and what each action depends on.
Dependencies may include:
- Grid connections
- Capital expenditure cycles
- Supplier contracts
- Technology availability
- Regulatory approvals
- Plant shutdown schedules
- Financing
- Internal decision-making
Each major intervention should have a timeline and a defined review point where progress is assessed against actual results.
-
Residuals and Removals—Last
Some emissions may remain after all economically and technically viable reduction measures have been implemented.
These residual emissions require a clear strategy for removals, whether through nature-based or engineered approaches.
Permanence, additionality, monitoring, and verification all need to be considered.
Buying removals early to compensate for emissions that could otherwise have been reduced can raise difficult questions from auditors, verifiers, investors, and stakeholders.
Reduction should come before compensation.
-
A Measurement and Verification Spine
The roadmap needs an ongoing system for tracking whether planned actions actually happened—and whether they delivered the expected results.
This means establishing:
- Monthly or periodic data collection
- Clearly assigned owners
- Defined KPIs
- Data-quality controls
- Progress reviews
- Periodic third-party verification
The objective is simple: progress should be demonstrable to a verifier, buyer, investor, or regulator when required.
Where Roadmaps Go Wrong
The same failures appear repeatedly.
The Boardroom Binder
A plan is written for directors but never translated into plant-level budgets, operational decisions, or team responsibilities.
If the maintenance manager has not seen the roadmap, it does not exist on the shop floor.
The Offset Shortcut
Credits are purchased in volume while process emissions remain largely unchanged.
It may look like progress on paper, but the approach becomes difficult to defend when a buyer, auditor, or regulator asks:
What actually changed inside the fence?
The Frozen Document
The first CCTS targets cover specific compliance periods, including 2025–26 and 2026–27.
A roadmap built around one regulatory cycle cannot simply be left untouched.
It needs to be revisited as new targets, technologies, costs, regulations, and business conditions emerge.
The Scope 3 Blind Spot
Supply-chain emissions can significantly exceed a company's operational emissions.
CDP's analysis of disclosures from more than 8,000 suppliers found that supply-chain emissions averaged 11.4 times companies' operational emissions, rising to 28 times in retail. CDP.
A roadmap that stops at the factory gate may therefore be solving the smaller problem first.
How Ploxi Consult Builds One
Ploxi Consult describes itself as a climate transition catalyst providing end-to-end sustainability services to organisations working towards net zero and ESG goals.
Its approach begins with assessing an organisation's existing ESG activities and identifying gaps, before moving towards decarbonisation interventions designed to deliver measurable emissions reductions. Ploxi Consult.
Applied to a decarbonization roadmap, this approach translates into four interconnected steps:
Gap Assessment → Baseline & Boundary → Abatement Strategy → Implementation & Verification
The gap assessment establishes where the organisation stands.
The baseline and boundary define what is being measured.
The abatement strategy determines which interventions should happen, when, and at what cost.
Implementation and verification establish whether those interventions actually deliver the intended reductions.
The result is not simply a strategy document.
It is a management system for moving from ambition to measurable emissions reduction.
The Chart Everyone Can Read
The semiconductor roadmap endured for more than two decades because engineers across competing companies could read the same chart and understand where they fit into it.
Carbon is heading in a similar direction.
As emissions-intensity targets reach sectors such as cement, refineries, textiles, aluminium, and iron and steel, a supplier's emissions can become a line item in another company's compliance or sustainability reporting.
That changes the role of the decarbonization roadmap.
The roadmap that matters next may be the one an entire supply chain can read.
Sources
- Roadmapping for Strategy and Innovation — Robert Phaal, University of Cambridge IfM, 2015
- Technology Roadmapping: Industrial Roots — University of Cambridge Repository
- Motorola's Technology Roadmap Process — Willyard & McClees, 1987
- SRC Timeline: 1992 — Semiconductor Research Corporation
- ITRS 2012 Update Overview
- Transistors Won't Shrink Beyond 2021, Says Final ITRS Report — HPCwire, July 2016
- Government Notifies GHG Emission Intensity Targets for Carbon-Intensive Industries — Press Information Bureau, January 2026
- Emission Targets Notified for Iron and Steel Units Under CCTS — LKS, July 2026
- Electric Motor Systems Platform — IEA 4E
- Environmental Supply Chain Risks to Cost Companies $120 Billion by 2026 — CDP
- Ploxi Consult